A monitoring solution must not be an isolated island, siloed in the greater IT landscape. Sharing information about infrastructure health, availability, performance and most common support calls across teams, such as application developers, application administrators and IT management, is crucial for an efficient business.
Microsoft System Center Operations Manager (SCOM) has many powerful features, but many people are not aware of all of its capabilities.
SCOM users frequently have questions about specific reports, which are available through SCOM’s built-in generic reports library.
Microsoft SCOM’s reporting capability is built on top of excellent Microsoft Reporting Services technology.
Using this technology, it’s possible to create complex, drill down reports with advanced data visualization in very short period of time. To simplify typical reporting tasks, Microsoft also provides set of predefined, generic reports that can be used as a basis to create specific reports based on your organizational needs.
Building a report in SCOM
Start by opening the Operations Manager console, then click on “Reporting” under the folder of the same name to find built-in reports. View the complete list and explanation of the purpose of each report.
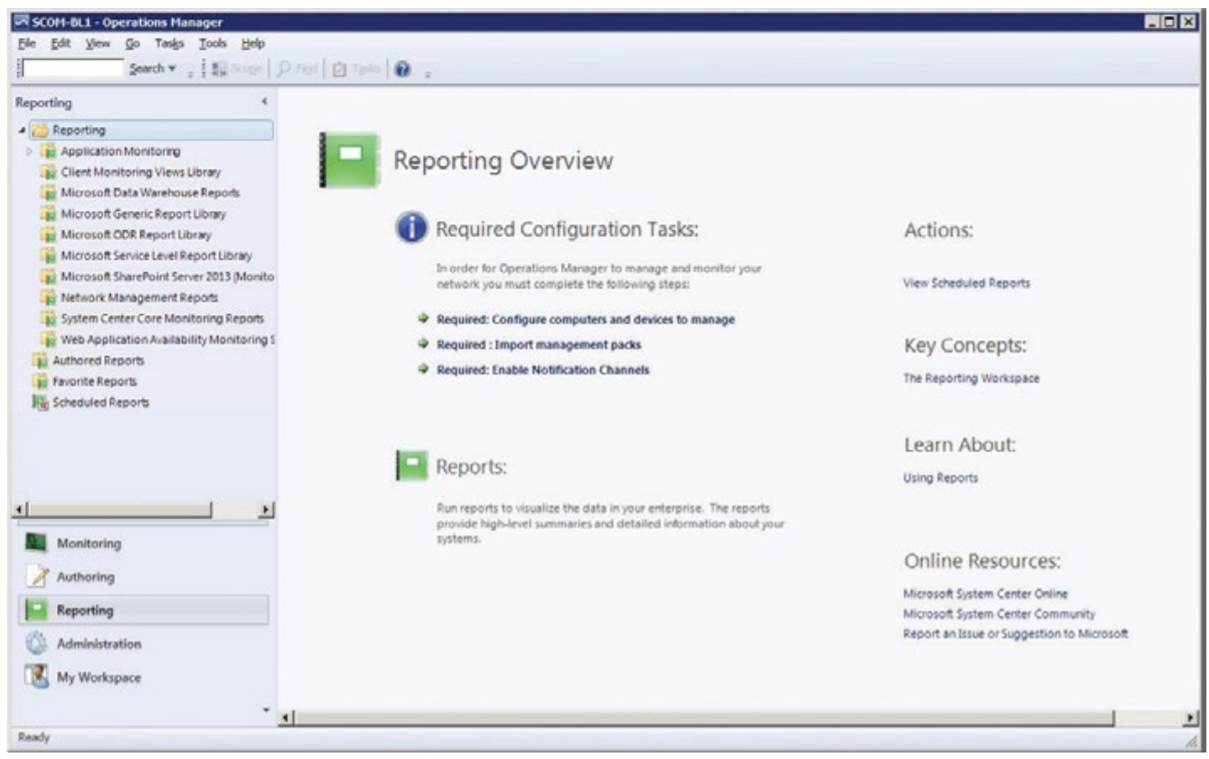
Let’s focus on the report options found within the Microsoft Generic Report Library. We will use generic reports to:
- Generate an application availability report using data collected from the F5 BIG-IP device via HYCU F5 BIG-IP MP
- Identify the most common occurrences related to application availability
- Track configuration changes on HYCU F5 BIG-IP MP virtual server configuration
- Show all overwrites in the management pack
We will also use pre-built report templates to show:
- Data warehouse properties
- Data volume by management pack
Application Availability Monitoring Report
Let’s start with the Application Availability Monitoring report, which can be found under Microsoft Generic Report Library. Every report includes a “Parameters” section at top, where you can filter the default generic report to show exactly what data you are interested in seeing.

Adjust the “From” and “To” parameters to show data for this month. Click on “Add Group…”to select “Virtual Servers” of “Virtual Server Group” class (F5 BIG-IP configuration representing application). In the popup window, type “virtual” to narrow down list, then click “add” and run the report. The result should look something like this:
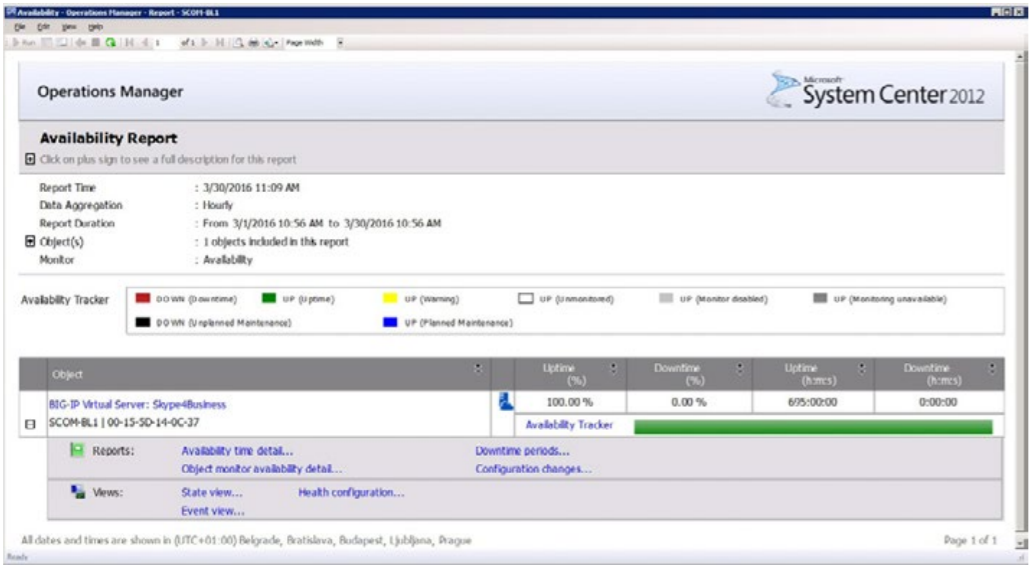
From this report, it is possible to drill down into the data further and learn more about availability time detail, including down time periods, configuration changes, and more. It’s also possible to access different views directly from report, such as State, Health configuration or Event view.
To use this report later, you can save it to the management pack from the File menu. Any report can be printed, and report data can be exported as XML, CSV, Excel and other file formats. It’s even possible to schedule report execution and, in combination with exporting data to machine readable formats (i.e. CSV), advanced automation scenarios are supported.
Most Common Alerts Report
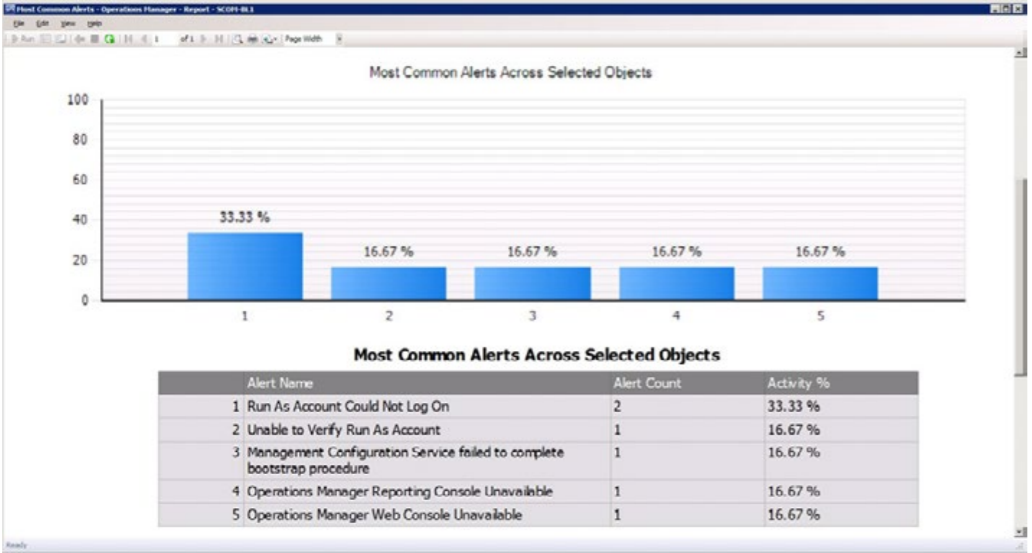
Let’s see a few more reports. Under Microsoft Generic Report Library, open the Most Common Alerts report. Adjust the time period of the report by changing “From” and “To” parameters, then run the report.
Configuration Changes Report
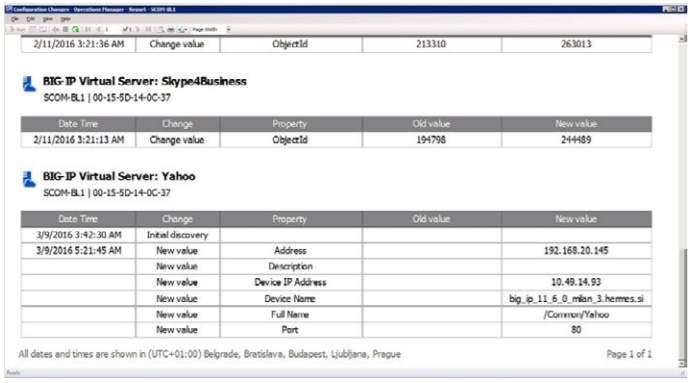
Under Microsoft Generic Report Library, open the Configuration Changes report. Adjust the time interval and click on “Add Group”. Add Virtual Servers Group (we are using HYCU F5 BIG-IP MP data for this report), and run the report.
Overrides Report
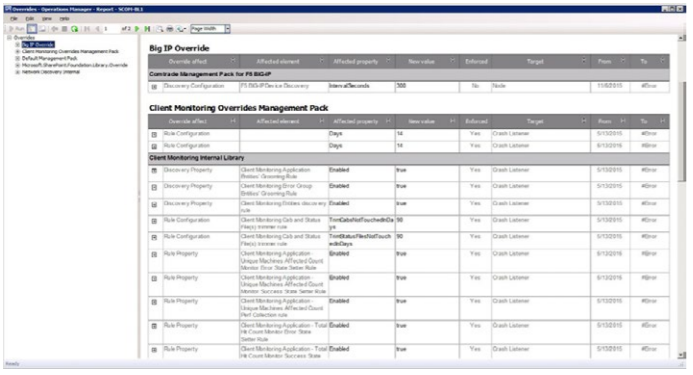
Open the Overrides report under Microsoft Generic Report Library. Adjust the time period and hit “Run.”
Microsoft Data Warehouse Reports
Let’s take a look at the Microsoft Data Warehouse reports. Open the Data Warehouse Properties report. As no parameters are required to run this report, it is automatically executed.

Data Volume by Management Pack
Let’s take a look at one more report. Under System Center Core Monitoring reports run Data Volume by Management Pack. Adjust the time period and run the report.
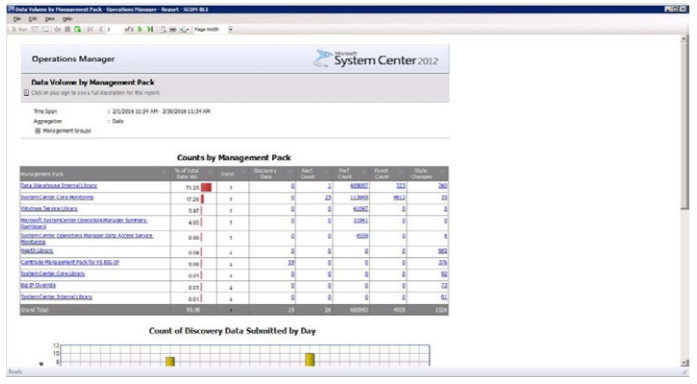
From this report, you can see not only the current situation, but also trend information to help you better understand your environment needs.
Thanks to built-in reports, it’s very easy to extract very useful data from SCOM, and open reporting technology allows you to create almost any report required. This reporting capability is a powerful feature of SCOM, as it provides access to information and it’s easy to integrate the data with other IT systems. We’ve highlighted just a few reports available in the SCOM Generic Reports Library, but there are many others available within the console. If you can’t find one for your reporting needs, you can develop a custom report with advanced knowledge of SQL and SCOM database, or work with a provider to design one for you.


